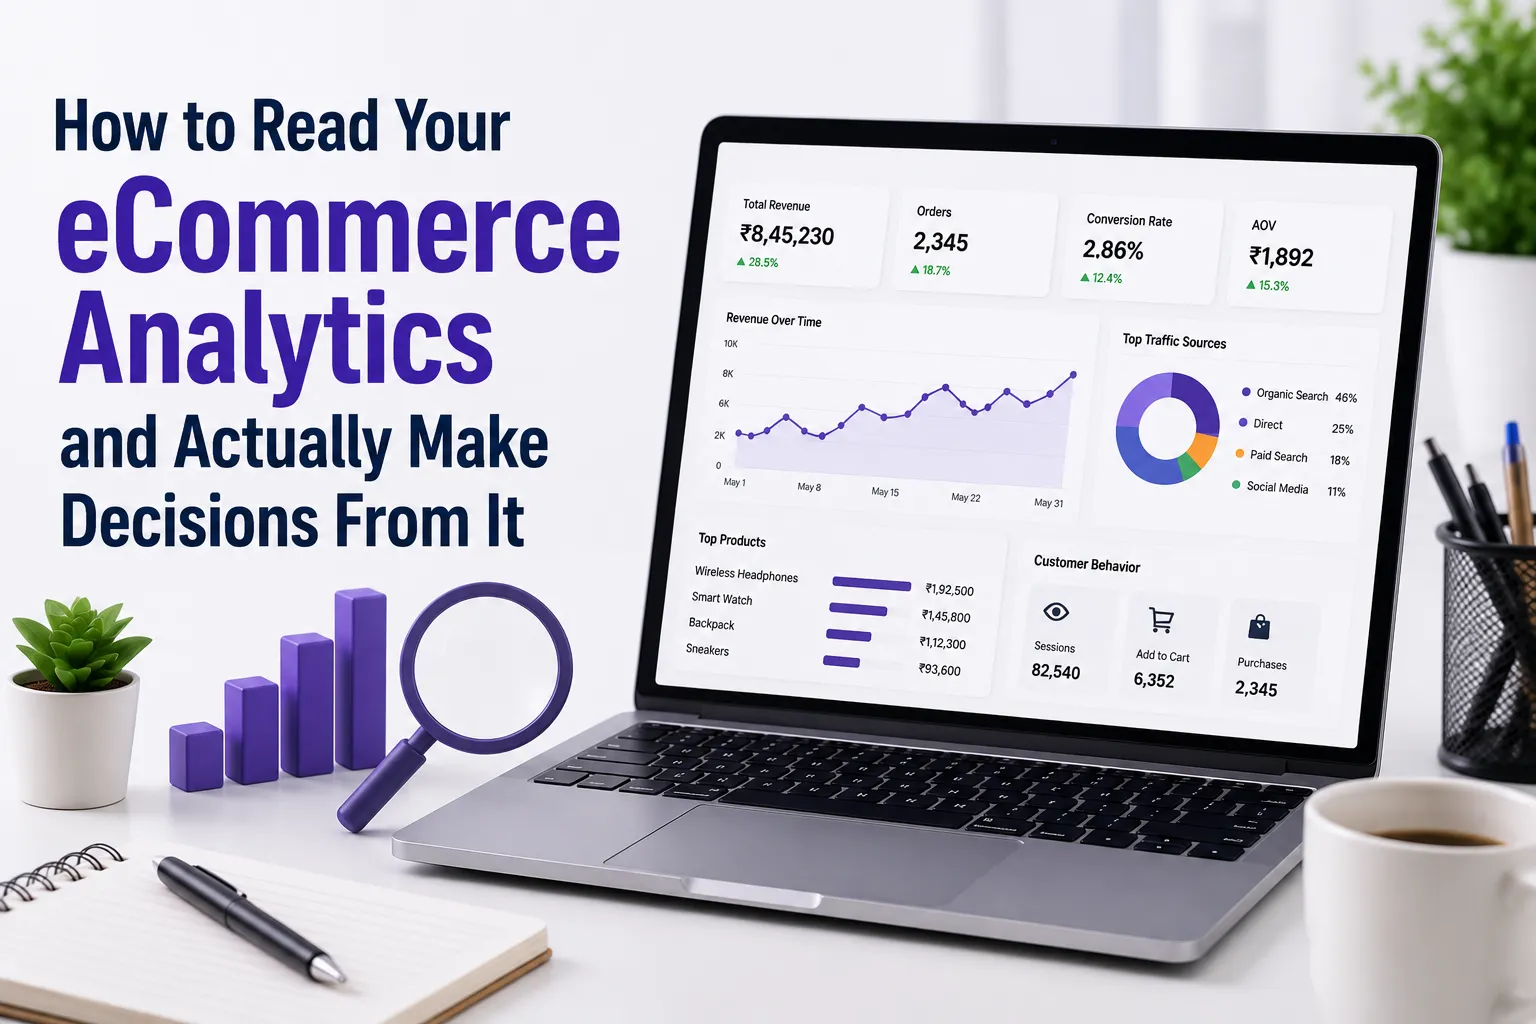
Data is only valuable when it changes what you do. Most eCommerce founders check their analytics dashboard regularly and still cannot confidently answer the questions that matter most: which channel is actually driving revenue, why conversion rates dropped last week, or whether a campaign change actually worked. This guide bridges that gap — not just what to track, but how to use it. If you are investing in performance marketing services, understanding your own data makes every conversation with your agency more productive.
The Metrics That Actually Matter
There are hundreds of metrics available in GA4 and your ad platforms. Most are interesting. A smaller set is actionable. The ones that should drive decisions: Sessions by channel (where traffic is coming from), Conversion Rate by channel (which traffic actually buys), Average Order Value (how much each order is worth), Revenue by channel (total attribution), and Returning Customer Rate (how well you are retaining buyers).
Everything else is either context for these numbers or a vanity metric. Track them, but do not let them distract from these five.
Setting Up GA4 for eCommerce Properly
GA4's eCommerce tracking requires proper configuration — it does not work fully out of the box with Shopify. You need enhanced eCommerce events: view_item, add_to_cart, begin_checkout, purchase. Without these, you are blind to where in the funnel users are dropping off. Most Shopify stores connect GA4 through Google Tag Manager or a dedicated app. If you are using Shopify SEO services, proper analytics setup is a core part of the technical foundation — not an afterthought.
Attribution: Why Different Platforms Show Different Numbers
One of the most confusing experiences in eCommerce marketing is when Google Ads, Meta Ads, and GA4 all report different revenue numbers for the same period. Google uses last-click attribution by default. Meta uses 7-day click and 1-day view. GA4 shows what it can track within its own model. None of them are wrong — they measure different things. Your actual revenue figure from your Shopify backend is the ground truth.
This is also why reviewing PPC campaign data alongside your store's order management data gives a more accurate picture of true channel performance. Read more about managing this complexity in the guide on scaling with performance marketing.
Using Data to Make Channel Decisions
Once analytics are properly configured, you can make data-driven channel decisions. If organic search drives 30% of sessions but only 10% of revenue, your SEO traffic is not converting — which is a landing page or product-market fit problem, not an SEO problem. If your PPC channel has a high conversion rate but high CAC, refine targeting rather than increasing budget.
Weekly vs Monthly Analysis
Not all metrics need the same review frequency. Revenue, orders, and ROAS should be checked weekly. Conversion rate, channel mix, and CAC should be reviewed monthly. SEO rankings and organic traffic trends are best assessed quarterly — short-term fluctuations are normal. Build a reporting cadence that matches the speed at which each metric legitimately changes. This is something a good digital marketing agency should be providing as standard, not something you should have to chase. If you are based in Delhi NCR, our performance marketing agency in Noida includes full analytics reporting as part of every engagement
GA4 is now the standard since Universal Analytics was deprecated. It has a steeper learning curve but provides more flexible event tracking, better cross-device reporting, and predictive metrics. The key is setting up enhanced eCommerce events correctly from the start.
In GA4, use the Traffic Acquisition report filtered by session source/medium. In your ad platforms, look at revenue attributed per campaign. For the most accurate view, cross-reference both against actual order data in Shopify Admin.
The average is 1–3% across categories. Fashion and consumables often convert at 3–5%. Electronics and furniture can be below 1%. Track your own baseline and focus on improving it week over week rather than comparing to an industry number that may not apply to your category.
In GA4, look at the Landing Page report filtered to product page URLs. Compare sessions to add-to-cart rate and conversion rate. Pages with high sessions but low add-to-cart rates have a content or trust issue. Pages with high add-to-cart but low purchase rate have a checkout issue.
For most brands, yes. GA4's native reports are comprehensive but not optimised for quick decision-making. A simple Looker Studio dashboard pulling your 5–7 key metrics into one view saves significant time and keeps the whole team aligned on what matters.