Industry: eCommerce (Apparel)Duration: April 6, 2019 – March 18, 2020Client Revenue Generated: ₹7.6 Crore
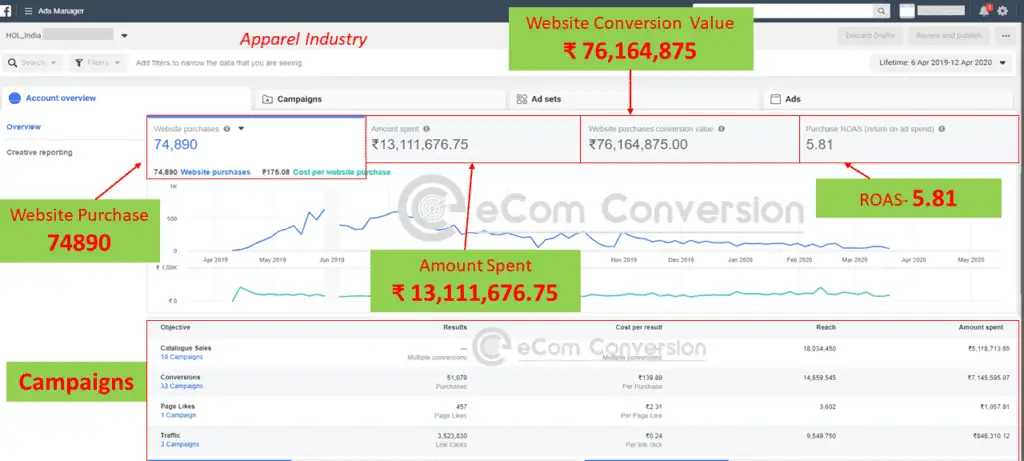
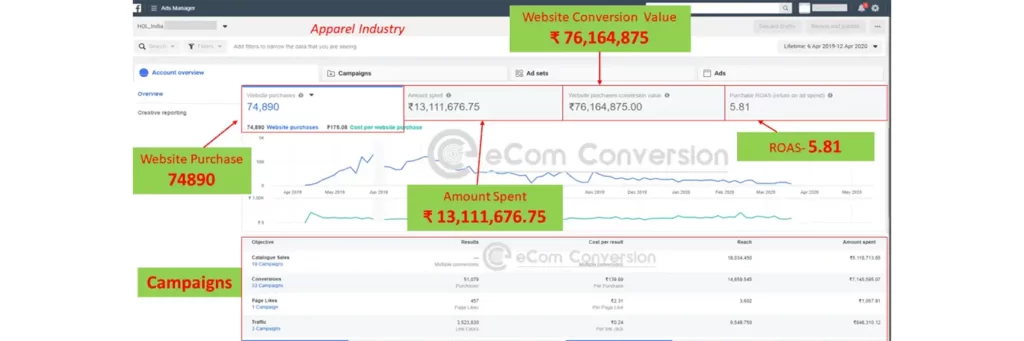
Total Website Purchases: 74,890
Ad Spend: ₹13,111,676.75
Website Conversion Value: ₹76,164,875.00
ROAS (Return on Ad Spend): 5.81
Max Sales in a Day: 647
Max Spend in a Day: ₹97,546.00
Max Daily Revenue: ₹783,458.00
Total Campaigns: 47
Like: 1
Traffic: 3
Conversion: 33
Catalogue Sales: 10
Ad Sets: 150
Ads Created: 500
Created using client inputs.
Continuously updated using cohort analysis from Facebook and Google Analytics.
Behavioral Analytics: Hotjar
Web Analytics: Google Analytics, Facebook Analytics, GTM
Competitor Analysis: Advertsuite
Customer Persona Tool: Uxpressia
Funnel Analytics: Geru
Reporting Tools: Internal Custom Formats
Traffic Campaigns targeting interest-based audiences
Video Reach Campaigns
Conversion Campaigns using LLA (Lookalike Audience) – Value pixel audience & Catalogue sources
Catalogue Sales Campaigns
Engaged page audiences
Viewers of videos (50%+ watched)
Refined retargeting audiences via GTM
Sequential and dynamic retargeting using catalogue ads
Targeted repeat customers with best-seller cross-category ads
Strong performance in driving conversions
Used aggressive display ads for BOF targeting
Formats: Single Image, Carousel, Instant Experience, Videos
Video Duration: Up to 12 seconds
Platform-optimized content for Instagram Stories and Facebook News Feed
CTR, CPM, Frequency
ATC (Add to Cart), Cost per ATC
ICT (Initiate Checkout), Cost per ICT
CPA (Cost Per Acquisition), ROAS
No. of Purchases, AOV (Average Order Value)
Unique Link Clicks, Landing Page Visits
Audience Saturation and Overlap
Used CBO (Campaign Budget Optimization) and ABO (Ad Set Budget Optimization)
Deployed automated rules for monitoring and scaling
A/B tested creatives, ad copies, and formats for the first two weeks
Leveraged Facebook Analytics for optimization
40% campaigns used manual bidding
RTO (Return to Origin): 20-27%
Cash on Delivery (COD): 80%
Prepaid Orders: 20%
Campaign Managers: 2
Creative Designer: 1
Data Analyst: 1
Ad Copywriter: 1